How did COVID impact my fitness?
Well, it was inevitable, the lurgy finally got me. I thought it’d be interesting to look at whether the impact of COVID is clear in my heart rate data. The post-COVID dataset remains minuscule, so this post simply compares a pre and post-COVID ride of similar lengths and efforts. This builds on my post on HR and power correlations
I took two rides, each the Hilly loop on zwift, ridden in the morning at a ‘steady’ effort of around 200W. The best linear fit between HR and power is compared in the plot below. 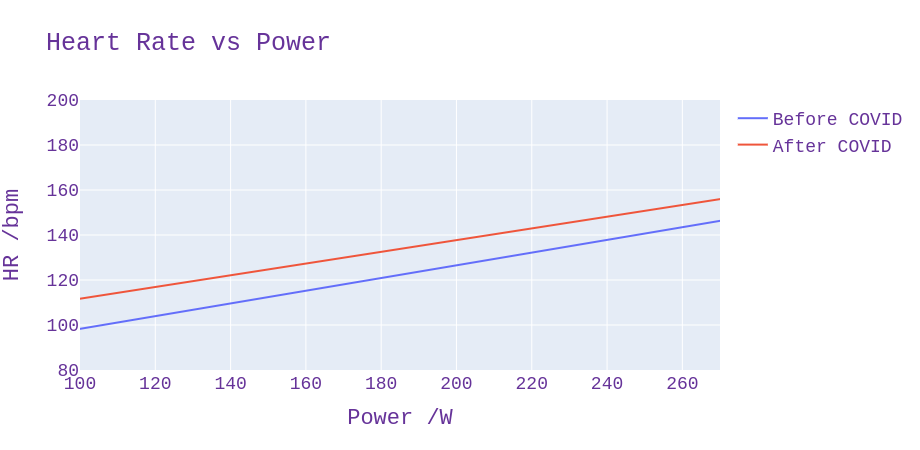
This is showing that there’s approx 10BPM difference. For me to hold the same power as pre-COVID I need an extra 10bpm. The slope of the linear fit is almost the same between the two activities. Given for 10BPM the slope of the graph means I can do about an extra 35W, that’s a pretty huge drop. 10% of FTP! Here’s hoping it returns quickly.